
You can grow revenue every quarter and still run out of cash. The number that decides which way it goes is your gross margin, and plenty of owners only look at it once a year when the accounts are filed.
That is a problem in a tight market. The average UK small business profit margin fell to 8.8% in 2024, down from 10.7% a year earlier. When the cushion is that thin, a few points of margin slippage is the difference between paying yourself and not.
What gross margin actually is
Gross margin is the share of each sale left after the direct cost of delivering it. The formula is simple: revenue minus cost of goods sold, divided by revenue, shown as a percentage. Cost of goods sold, or COGS, means the costs that only exist because you made the sale: stock, raw materials, and the wages of the people doing the billable work. Rent, software, and your own salary sit below the line. They are overheads, not COGS.
Here is a worked example. A kitchen supplier sells £40,000 of units in a month. The units cost £26,000 to buy in. Gross profit is £14,000. Divide that by £40,000 and the gross margin is 35%. For every £1 of sales, 35p is left to cover everything else and to make a profit.
What a falling margin is telling you
Margin movement is an early signal, weeks ahead of your bank balance. A rising margin means you are keeping more of every sale: better buying, sharper pricing, or a richer product mix. A falling one means the opposite, and it slips long before profit does.
Say that 35% drops to 30%. On £40,000 of sales that is £2,000 of gross profit gone in a single month, with no change in how busy you feel. Multiply across a year and a five point fall quietly removes £24,000. Busy and broke is almost always a margin story.
How to track it properly
- Pull revenue and COGS from your accounting software, not from memory.
- Check it monthly, not annually. Quarterly at the absolute least.
- Track margin by product line or job type, not one blended figure. The blend hides your worst sellers.
- Compare against your own trend first, then a sector benchmark. As an illustration only, many hospitality businesses aim for gross margins of roughly 60% to 70%, while grocery retail runs far lower.
- Watch the direction over three months. One bad month is noise. Three is a trend.
What to do when it falls
There are three usual causes, and each needs a different fix.
Costs crept up. A supplier raised prices and you absorbed it. Re-quote your top three input costs and pass on what you can, or switch supplier.
Your prices are stale. Costs rose, your prices did not. Raise prices on your lowest margin lines first, even by 5%, and watch what actually loses customers. Usually less than you fear.
Your mix shifted. You are selling more of the low margin stuff. Look at which products carry the margin and sell more of those on purpose.
One more trap: confusing markup with margin. A 50% markup on cost is only a 33% margin. Mix those up and you underprice every job.
One thing to do this week
Open last month’s accounts. Find total sales and total direct costs. Subtract, divide by sales, and write the percentage on a sticky note. Then do the same for the same month last year. The gap between those two numbers is your homework.
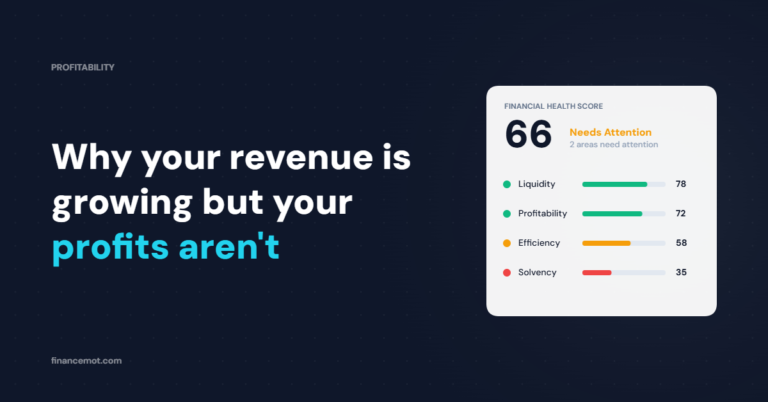
FinanceMOT reads your gross margin straight from your accounts and shows you the trend, not just this month’s number. It sits under the Profitability pillar, one of the four areas behind your 0 to 100 score, alongside Liquidity, Efficiency, and Solvency. Rather than leaving you with a figure on a page, it gives a plain reading of whether your margin is holding or quietly slipping, and flags what to check first. That turns a once-a-year realisation into something you can act on this month.