Most owners can tell you last month’s sales figure to the pound. Ask them their gross margin, and the room goes quiet. Sales feel like progress. They are not the same as a healthy business, and the gap between the two is where companies quietly get into trouble.
Why this matters at SME scale
Nearly half of UK SME owners have never identified a single key performance indicator for their business, according to a survey by Geckoboard. That is not a small gap. It means the owner is steering on the number that is easiest to see, revenue, and flying blind on the numbers that decide whether that revenue becomes cash.
The cost of that blindness is real. Late payment alone closes around 38 small UK businesses every day, and the average small firm is owed roughly £22,000 in overdue invoices at any one time. A business watching its debtor days would have seen that creeping up months before it became a crisis. Most never look.
What tracking five numbers actually involves
A KPI, or key performance indicator, is a single number that tells you whether one part of the business is working. You do not need forty of them. You need five, reviewed on the same day every month. Five is enough to see the whole picture and few enough that you will actually do it each month.
Pick the date. Say the 10th, once last month’s bookkeeping is done. Put the five numbers in one place. Write last month’s figure beside this month’s, and the same month a year ago beside that. The trend matters more than the number. A 38% gross margin means little on its own. A 38% margin that was 44% in January is a flashing light.
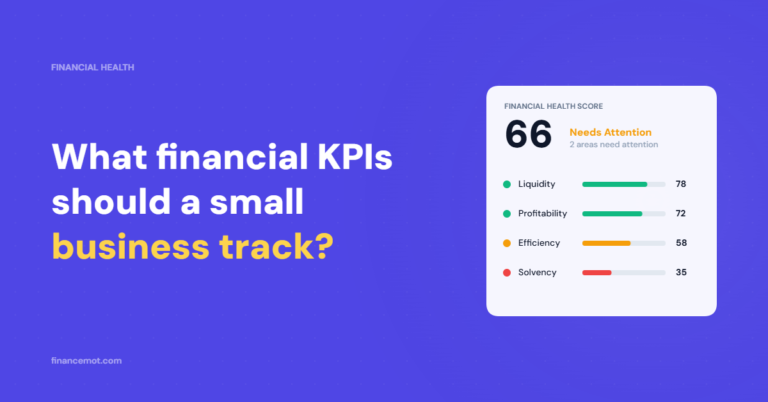
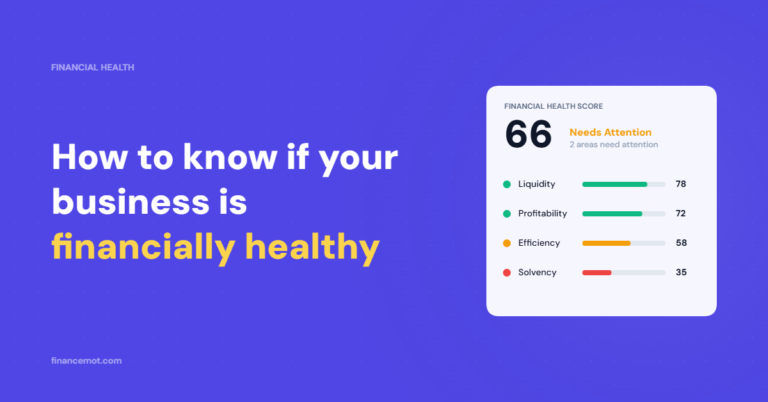
Keep the four pillars in mind: liquidity, profitability, efficiency and solvency. One or two numbers each, and you have covered the whole business. Choose numbers you will act on, not ones that simply look impressive in a report.
The five numbers to track
- Cash runway (liquidity): how many months you can keep trading at today’s spending rate if income stopped. Cash in the bank divided by average monthly outgoings.
- Gross margin (profitability): sales minus the direct cost of delivering them, as a percentage. Your pricing and supplier deals in one figure.
- Operating profit margin (profitability): what is left after all running costs, before tax and interest. It tells you whether the whole model pays.
- Debtor days (efficiency): the average number of days your customers take to pay. Rising debtor days drain cash even when sales look fine.
- Current ratio (solvency): current assets divided by current liabilities. Below 1 means you owe more in the short term than you can cover.
What good looks like
Take a 22-person design agency in Leeds turning over £2.4 million. The finance lead spends an hour on the 8th of each month updating one sheet. In March she saw debtor days jump from 41 to 58. Two large clients had quietly drifted into paying late. She did not panic. She put both accounts on hold until they cleared the backlog and tightened terms on new work. Cash held. No overdraft, no awkward call to the bank. The number gave her three months of warning the bank balance alone never would.
This is the hard part for a small team: pulling five numbers together every month, spotting the trend, and knowing which one needs action first. FinanceMOT does that read for you. It scores your business 0 to 100 across the four pillars, liquidity, profitability, efficiency and solvency, flags the KPI signals moving the wrong way, and tracks them across multiple periods so the trend is plain. Your accountant shows you the numbers. FinanceMOT tells you what to do about them.